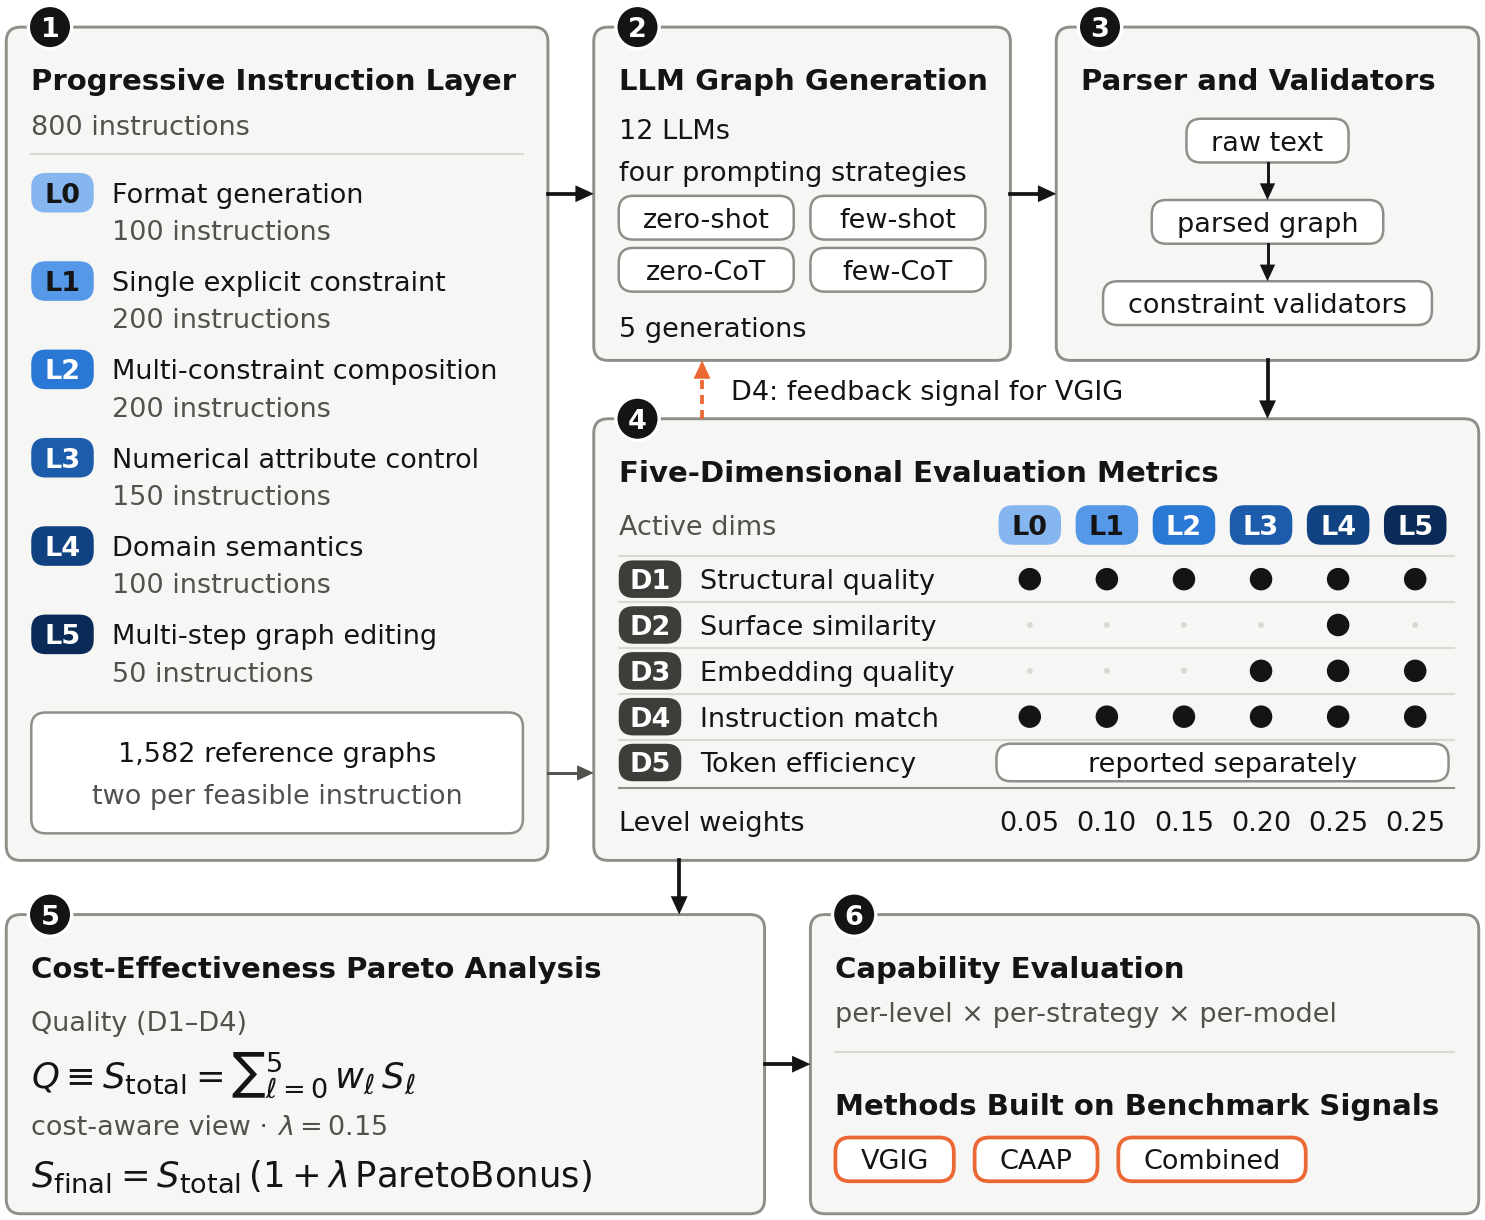
GraphInstruct stratifies instruction-following graph generation into six constraint-type levels, from format generation (L0) to multi-step graph editing (L5), and scores every output on five deterministic dimensions. No LLM judge is used anywhere in the evaluation. The release ships 800 instructions, 1,582 reference graphs, the evaluator, the scripts behind every table and figure of the paper, and the per-instance scores of every reported run.
One ladder from format compliance to graph editing
A single aggregate score hides where a model breaks. GraphInstruct separates the skills that graph generation actually asks for, one constraint type per level, so that the score profile of a model shows which step of the ladder it fails.
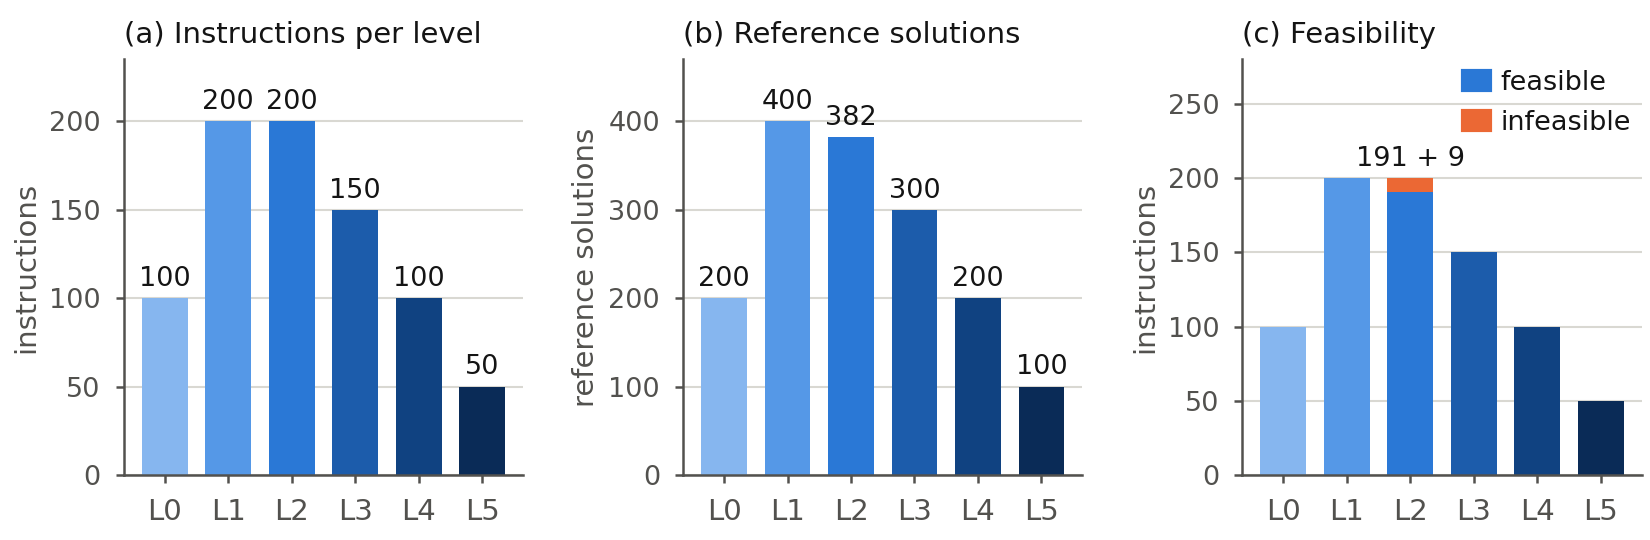
Six levels, weighted toward the harder constraints
The quality score is a weighted mean over levels, and the weights rise with the level, so a model cannot carry a high total on format compliance alone.
| Level | Constraint type | Instructions | Weight |
|---|---|---|---|
| L0 | Format generation | 100 | 0.05 |
| L1 | Single explicit constraint | 200 | 0.10 |
| L2 | Multi-constraint composition | 200 | 0.15 |
| L3 | Numerical attribute control | 150 | 0.20 |
| L4 | Domain semantics | 100 | 0.25 |
| L5 | Multi-step graph editing | 50 | 0.25 |
L3 draws on a pool of 3,115 synthetic graphs; L4 on 1,048 graphs, of which 620 come from five public datasets and 428 are synthetic.
Five deterministic dimensions
Every metric is computed by code in the released evaluator, so a score can be recomputed from a stored response file. D1 to D4 are combined into the reported quality score; D5 is reported on its own.
Structural quality
Whether the emitted graph meets the structural constraints of its level, as checked by the constraint validators.
Surface similarity
How closely the output agrees with the reference solution at the surface level.
Embedding quality
Agreement with the reference in a learned graph embedding space, for the levels where it is defined.
Instruction match
Whether the output follows the instruction as stated. VGIG uses this dimension as its feedback signal.
Token efficiency
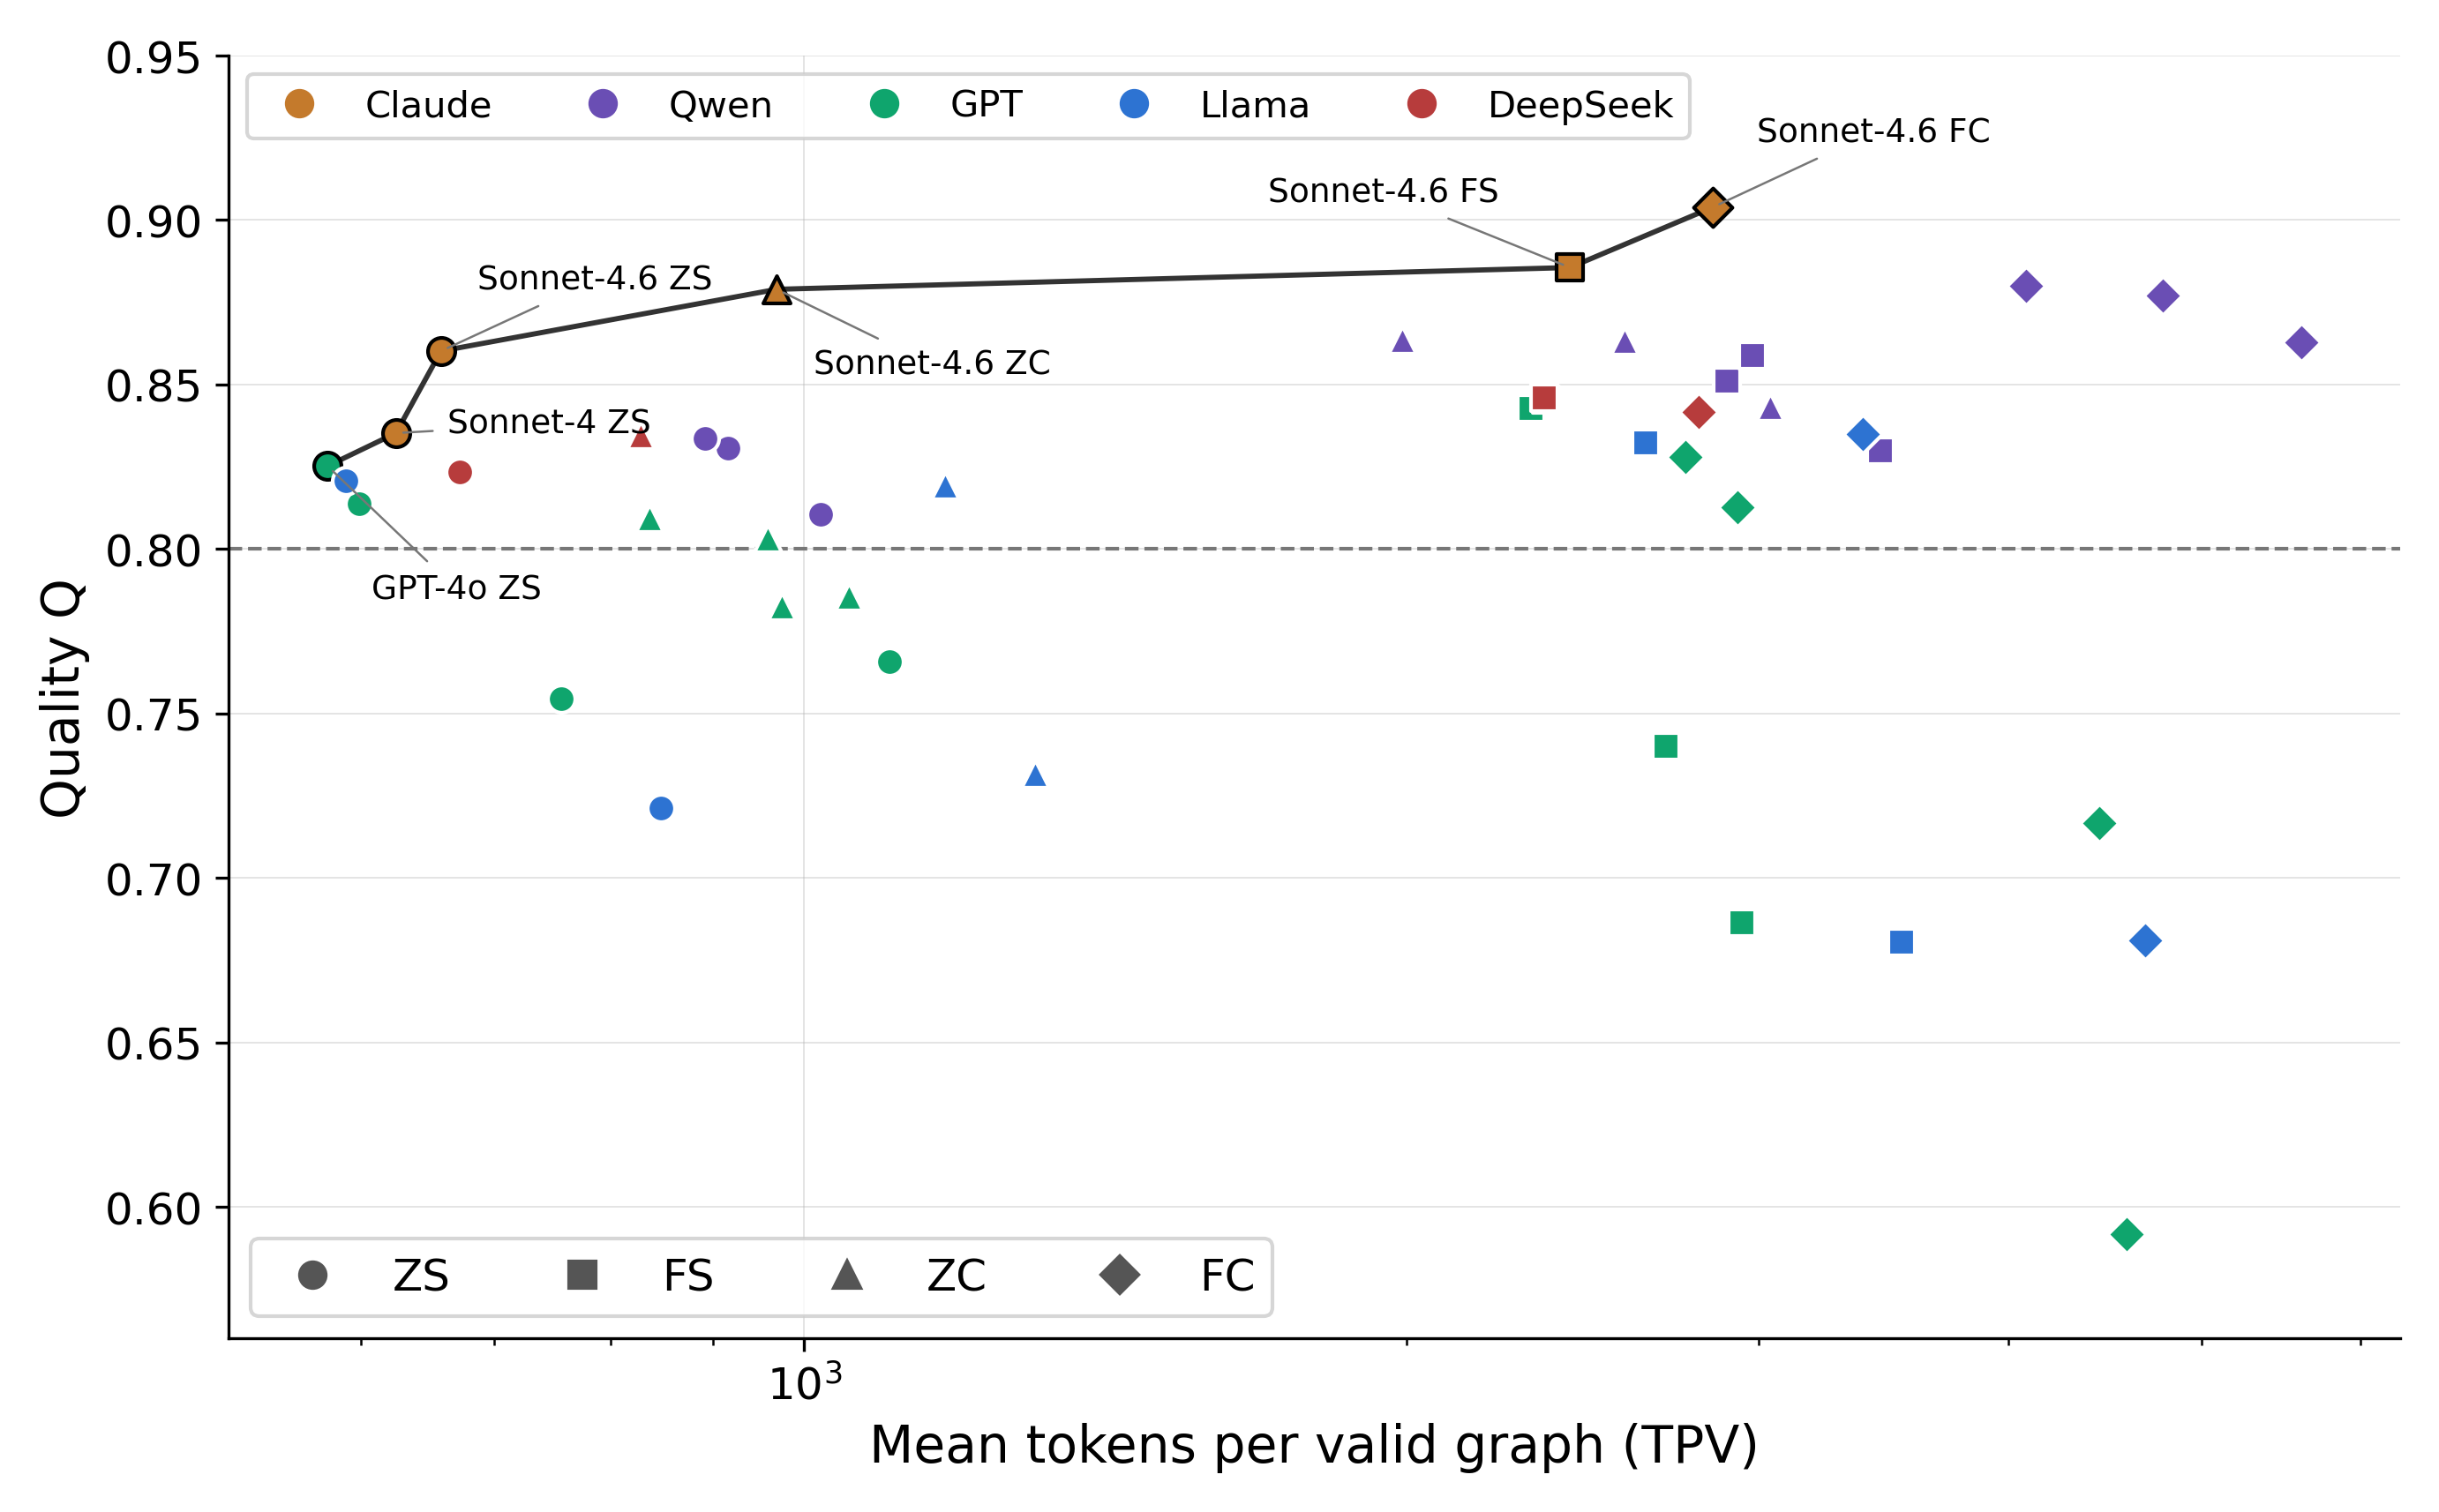
Tokens spent per valid graph. It sits outside the weighted quality score and enters the cost view instead, so a configuration is never rewarded for being cheap at the price of being wrong.
Quality by strategy, by level, and against cost
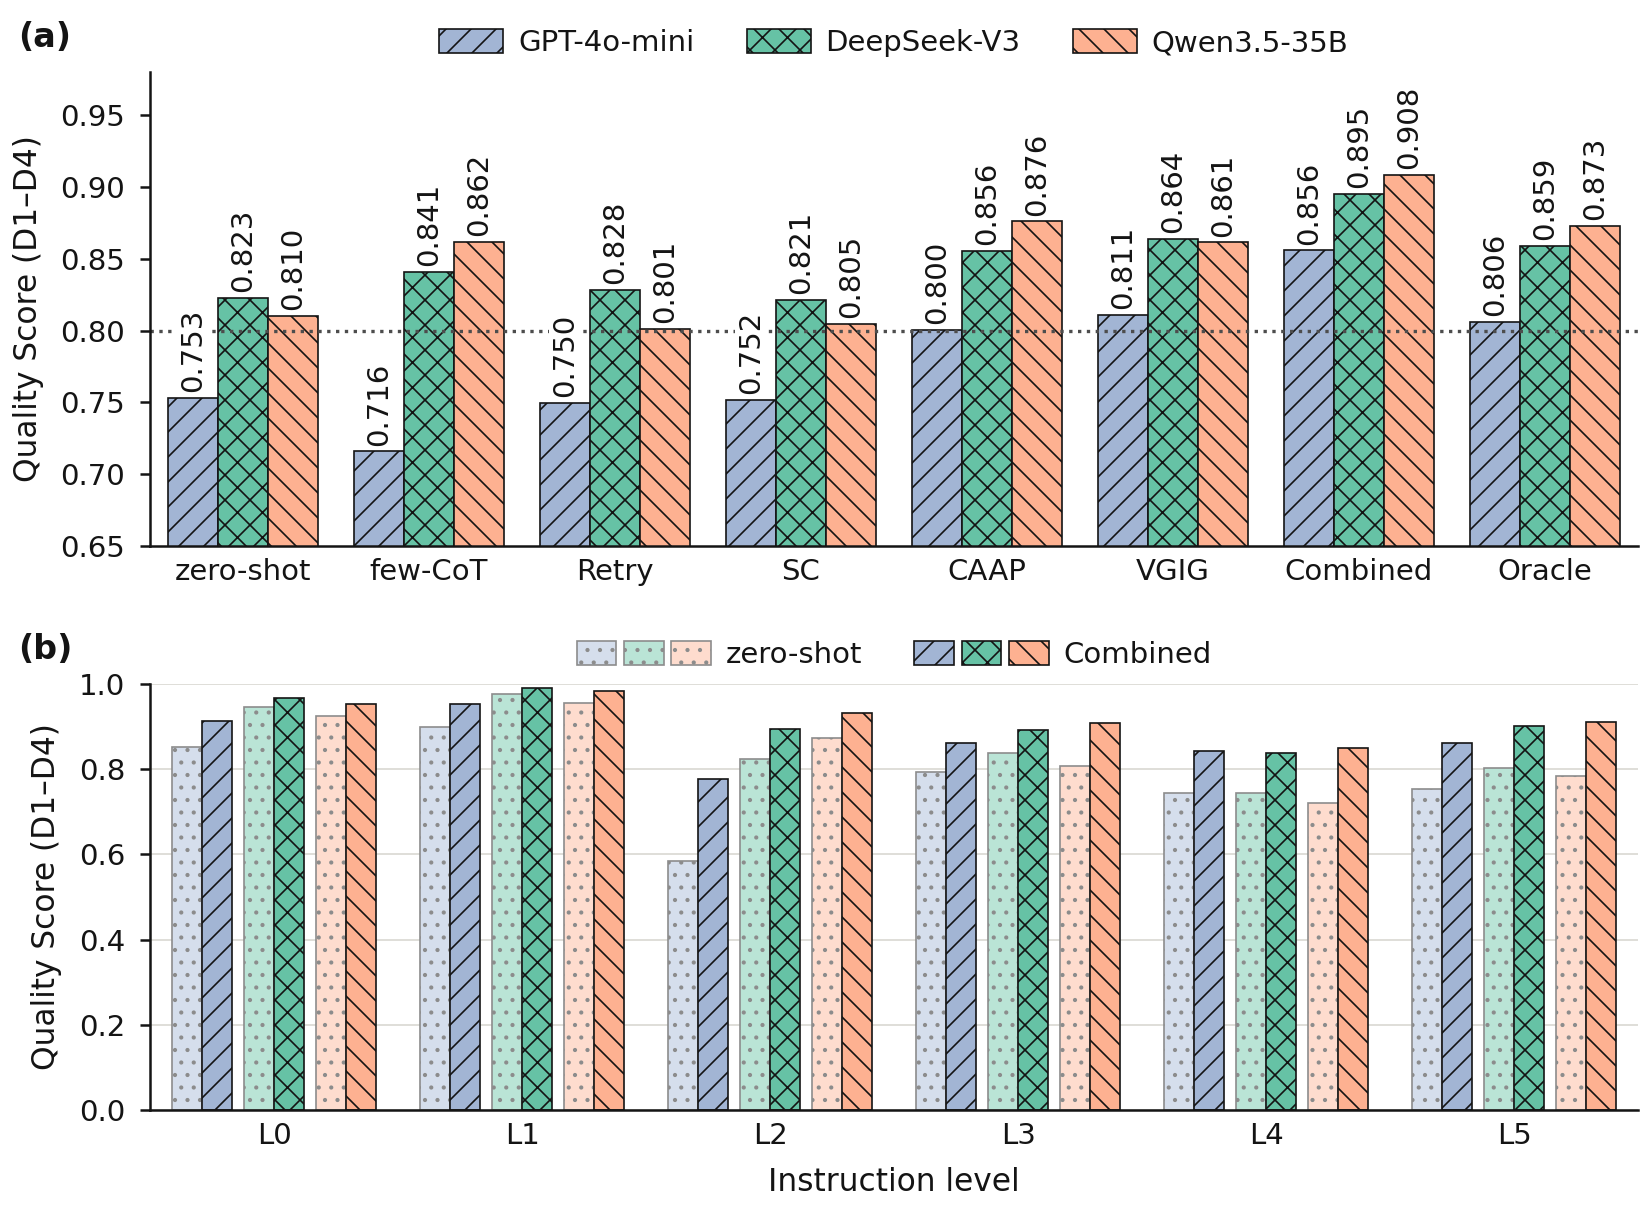
Panel (a) places the four prompting strategies next to the three methods built on the benchmark signals. Panel (b) breaks the same comparison down by level, which is where the differences between configurations become visible; a single aggregate hides them.
Top five of the 45 configurations by quality
| Rank | Model | Strategy | Quality |
|---|---|---|---|
| 1 | Sonnet-4.6 | few-CoT | 0.904 |
| 2 | Sonnet-4.6 | few-shot | 0.886 |
| 3 | Qwen3.5-397B | few-CoT | 0.880 |
| 4 | Sonnet-4.6 | zero-CoT | 0.879 |
| 5 | Qwen3.5-122B | few-CoT | 0.877 |
Score a model in a few commands
Everything below runs offline from the released files and the stored responses on Zenodo. No model API is called during scoring.
# install the evaluator
pip install -e .

# unit tests (more than 900)
python -m unittest discover -s tests

# a five-minute tour
jupyter notebook examples/01_quickstart.ipynb
To score your own run, generate the responses and then evaluate the checkpoint:
python scripts/eval_checkpoint.py results/<model>-<strategy>.jsonl \
    --strategy <strategy> --quality-only \
    --output results/<model>-<strategy>.quality.json
Full options are in docs/REPRODUCE.md; examples/02_eval_your_model.ipynb walks through the same path against an OpenAI-compatible endpoint.
Three data versions, all kept
A post-review audit corrected 37 of the 50 L5 items. The version as reviewed stays available, every change is listed in the errata, and v1.1 adds 100 further L5 instructions, a 40-item stress subset and 150 paraphrased L1 to L3 instructions.
- v1.0 as reviewedGit tag
v1.0-as-reviewedandarchive/v1.0-as-reviewed/, with a checksum manifest - v1.0 with corrections
data/instructions/, with every change listed indata/instructions/ERRATA.md - v1.1The corrected v1.0 plus the 100 added L5 instructions; DOI 10.5281/zenodo.23330977
- Model responses383 checkpoint files, 495,460 responses, archived on Zenodo as two
raw-responsesarchives
Where everything lives
- Repositorygithub.com/AI4DataSynth/GraphInstruct_formal — data, evaluator, scripts, results, tests
- Responses (Zenodo)10.5281/zenodo.21596997, about 1.7 GB; unpack at the repository root
- Scores
results/, per-instance*.quality.jsonplus run metadata; indexed byresults/RELEASE_MANIFEST.tsv - Tables and figures
paper_tables/index.jsonmaps each table and data figure to its module, inputs and command - Reproductiondocs/REPRODUCE.md, including the regenerated-L5 and official-API rules
- Data schemadocs/DATA_README.md and the datasheet docs/DATASHEET.md
- Installationdocs/INSTALL.md, including the optional dependencies
Cite the paper and the dataset
@inproceedings{wei2026graphinstruct,
  title     = {{GraphInstruct}: A Progressive Benchmark for Diagnosing
               Capability Gaps in {LLM} Graph Generation},
  author    = {Wei, Zihe and Xiang, Sheng and Zhang, Ying and Jiang, Changjun},
  booktitle = {Advances in Neural Information Processing Systems
               (Evaluations and Datasets Track)},
  year      = {2026}
}
If you use the L4 reference pool, please also cite the upstream datasets listed in docs/DATA_LICENSE.md.
Terms
- CodeMIT
- Instructions, reference solutions, synthetic pools, documentationCC BY 4.0
- L4 graphs from public datasetsUpstream terms; see LICENSE-DATA and THIRD_PARTY_NOTICES
- Model outputs and scoresCC BY 4.0 for the authors' rights; model providers may impose further terms